Visualizing company incorporations per sector
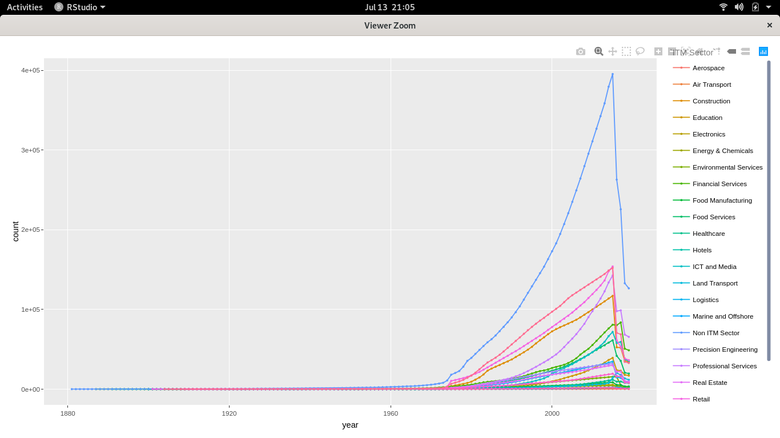

The challenge was to visualize the dataset consisting of over 1 million records with a complex processing step. In this case we needed to count the number of companies that were active per sector from the first company incorporated in the 1800s to date. The first graph looks prettier, however, it is difficult to study. The second uses a log-scale on the y-axis to separate lines with low counts that are close together while allowing high counts to still be compared in the same graph.

Mi perfil
We are an IT and Data Science company with a combined expertise of 20+ years experience in the IT field - specifically Linux and Windows systems administration, and 5+ years in the data science field - we have expertise in statistical analysis, predictive analysis, machine learning and big data. We have expertise with all major cloud platforms i.e. Amazon Web Services, Google Cloud Platform and Microsoft Azure. Contact us for: + Descriptive and predictive analysis of data, machine learning, big data + R programming and Shiny interfaces/dashboards + Systems integration, web scraping, API creation + Linux systems administration